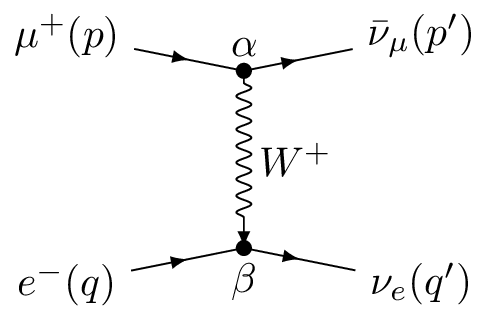
There is a package for making Feynman diagrams in LaTeX. Unfortunately, it is
old and dvi latex only. If you are using pdflatex or lualatex, as you should
be, it does not work. Even in regular LaTeX, it’s a bit of a pain. Why is there
not a new package for pdflatex? Turns out, you don’t need one. Due to the
powerful drawing library Tikz, you can create any diagram easily, and can
customize it completely. For example:

For the following, I highly recommend using LyX, even if you plan to use the finished diagram in LaTeX. As you’ll see, you can get near real time previews of the diagrams.
First, you’ll want to have something like this in your preamble (or in Preferences->Document Settings -> Latex Preamble in LyX).
\usepackage{tikz}
\usetikzlibrary{decorations.pathmorphing}
\usetikzlibrary{decorations.markings}
\usetikzlibrary{positioning, shapes, snakes, arrows}

\tikzset{
quark/.style={postaction={decorate},
  decoration={markings,mark=at position .5 with {\arrow[#1]{latex}}}},
scalar/.style={dashed,postaction={decorate},
  decoration={markings,mark=at position .5 with {\arrow[#1]{latex}}}},
gluon/.style={decorate,
 decoration={coil,amplitude=2pt, segment length=2pt,  pre length=.1cm, post length=.1cm}},
boson/.style={-latex,decorate, decoration={snake, segment length=4pt, amplitude=1.8pt, pre length=.1cm, post length=.25cm}},
photon/.style={decorate, decoration={snake, segment length=4pt, amplitude=1.8pt,  pre length=.1cm, post length=.1cm}},
dphoton/.style={decorate, decoration={snake, segment length=4pt, amplitude=1.8pt,  pre length=.1cm, post length=.25cm},-latex}
}
Aside: Although not necessary, you’ll probably want the slashed package also if you are working with QFT and are writing equations. You can add it using a LyX macro and a replacement, such as
\s{#1}:=\slashed#1 \acute{#1}or similar), allowing it to show up in LyX Math Mode.
T channel diagram
\begin{tikzpicture}[scale=1.5]
To draw a figure, you’ll need to define the vertices first. Tikz uses a standard coordinate system, starting from (0,0) and automatically sets the bounding box to fit the contents (though you can set one manually). Don’t worry too much about the units, you can always scale the picture after you created it with the scale option.
\def\wid{.7};
\def\iwid{.5};
Tikz allows you to define constants (it is still LaTeX, after all), so I’m going to define a couple of values here (these are actually going to be used as heights, despite my name choice). I can easily move the coordinates symmetrically with these. I don’t have to end these lines with a simicolon, but Tikz lines do end in semicolons, so I’m being consistent.
\node (mu) at (-1,\wid) {$\mu^{+} (p)$};
\node (e) at (-1,-\wid) {$e^{-} (q)$};
\coordinate (Wu) at (0,\iwid);
\coordinate (Wd) at (0,-\iwid);
\node (numu) at (1,\wid) {$\bar\nu_\mu (p')$};
\node (nue) at (1,-\wid) {$\nu_e (q')$};
Now, I’m setting up the vertices. There are two kinds; \coordinate is simply a
named coordinate, with a name given in parentheses and at a location. Nothing
visually is added here at this point.
\node is the same, but it also has a label given in curly brackets. If you
wanted to give options, such as a direction to offset the point, those would
come in square brackets. You usually do not need separate nodes for labels, the
ones you use for lines should work too.
The coordinates are specified as (x,y), though (radius:angle) is also
possible.
Notice that a line of Tikz starts with a backslash, and ends with a semicolon.
\draw [fill=black] (Wu) circle (.04) node [above] {$\alpha$};
\draw [fill=black] (Wd) circle (.04) node [below] {$\beta$};
This creates the “dot” at the vertices for the interaction. I’m chaining commands; note that chained commands don’t start with a backslash, and they use the location of the previous command. The proper way to read the first line would be: draw, with a black fill, at the point Wu, a circle with radius 4, and put a node label of $\alpha$ above.
\draw [boson] (Wu) -- (Wd) node [midway, right] {$W^{+}$};

\draw [quark] (mu) -- (Wu);
\draw [quark] (Wu) -- (numu);

\draw [quark] (e) -- (Wd);
\draw [quark] (Wd) -- (nue);
Here we are actually drawing the diagram. We are using the previous style
definitions to decorate our paths, which makes them look like the correct
particle. The -- command draws a straight line from one point to another. The
[midway] option for nodes puts the node in the middle of the previous two
points. You can still use offsets, too. We have named all of our coordinates,
though we could directly enter points if needed.
We can chain coordinates together as we draw lines (use \path to avoid drawing
the line). Prepending a + will make a coordinate relative, and ++ will make
it relative and not move the cursor to the new position. Combined with polar
coordinates, this makes even complex diagrams easy. You can also do math with
nodes, though you’ll need \usetikzlibrary{calc} to do that.
\end{tikzpicture}
And that’s it! The result:

For further information, see
QCD Process
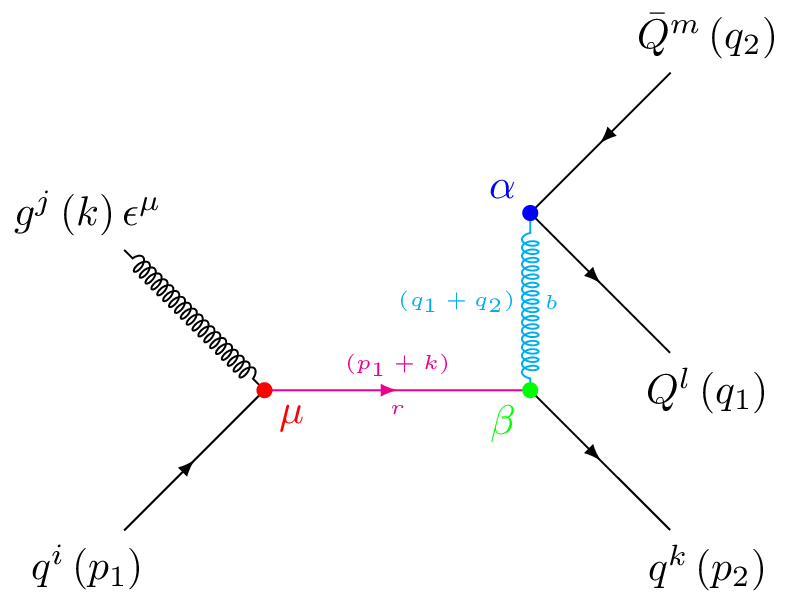
This is the cover image of the article; one of the diagrams for a QCD process of the form:
$$ \left(p_{1}\right)+g\left(k\right)\rightarrow q\left(p_{2}\right)+Q\left(q_{1}\right)+\bar{Q}\left(q_{2}\right). $$
The code to create it is as follows:
\begin{tikzpicture}[scale=1.5]
\node (g) at (-1,1) {$g^j\left( k \right) \epsilon^\mu$};
\node (qi) at (-1,-1) {$q^i\left( p_1 \right)$};
\coordinate (mu) at (0,0);
\coordinate (b) at (1.5,0);
\coordinate (a) at (1.5,1);
\node (qf) at (2.5,-1) {$q^k\left( p_2 \right)$};
\node (Q1) at (2.5,0) {$Q^l \left( q_1 \right)$};
\node (Q2) at (2.5,2) {$\bar Q^m \left( q_2 \right)$};

\draw [gluon] (g) -- (mu);
\draw [quark] (qi) -- (mu);
\draw [quark, magenta] (mu) -- (b) node [midway, below] {\tiny $r$}
                          node [midway, above] {\tiny $\left( p_1+k \right) $};
\draw [quark] (b) -- (qf);
\draw [gluon, cyan] (b) -- (a) node [pos=.5, right] {\tiny $b$}
                               node [pos=.5,left] {\tiny $\left( q_1+q_2 \right) $};
\draw [quark] (Q2) -- (a);
\draw [quark] (a) -- (Q1);

\draw [fill,red] (mu) circle (.04) node [below right] {$\mu$};
\draw [fill,green] (b) circle (.04) node [below left] {$\beta$};
\draw [fill,blue] (a) circle (.04) node [above left] {$\alpha$};

\end{tikzpicture}
Bonus:
To easily make standalone figures, use the standalone class. You can even use
the convert option and --shell-escape to have it create other formats, like
.png for web embedding.